statistical infographics are great to show case your data. This type of infographic is also used to show information that would have been in a boring table.
Below we show the steps to create Statistical infographics using AI with InfographicNinja:
For Statistical designs, we suggest using template 8.
Lets start by opening the AI infographic Generator tool.
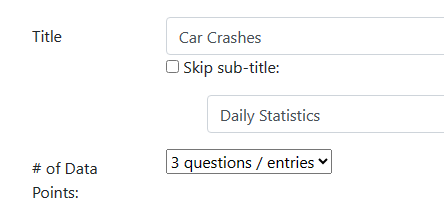
First, enter a title:
Next, enter your data into the headings and explanations into the description boxes
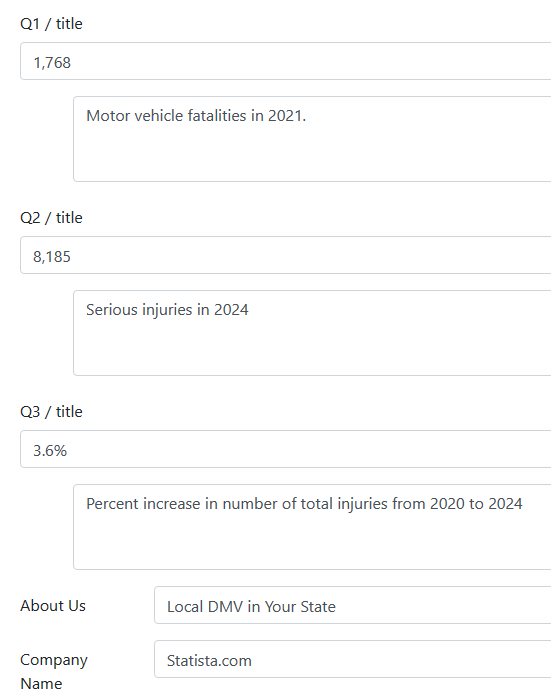
Enter some words to choose your icons
Finally, download your infographic.
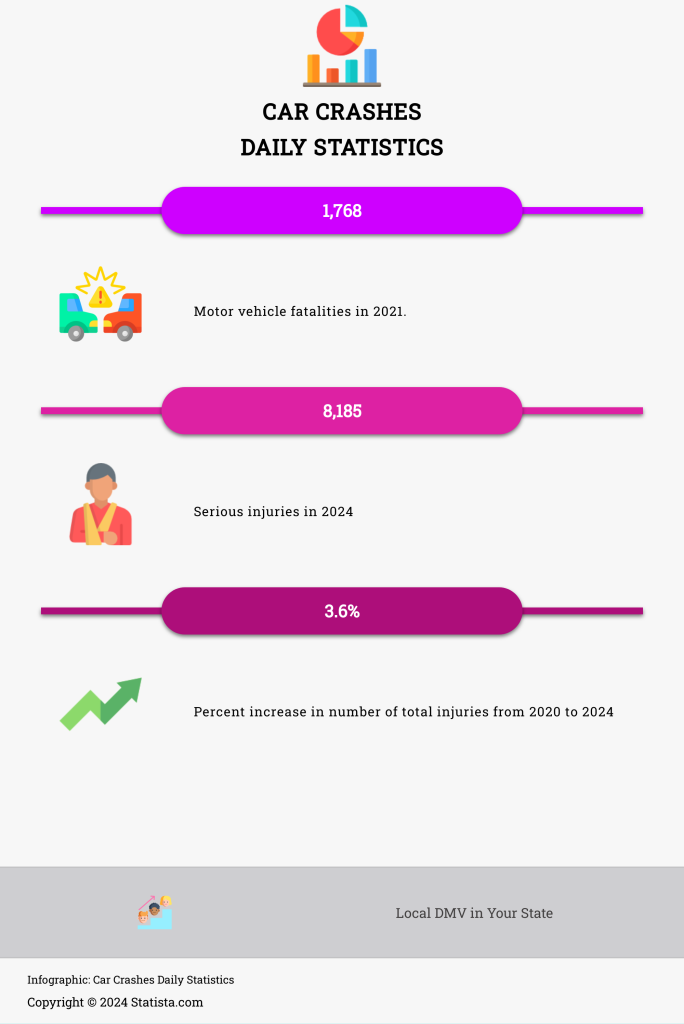
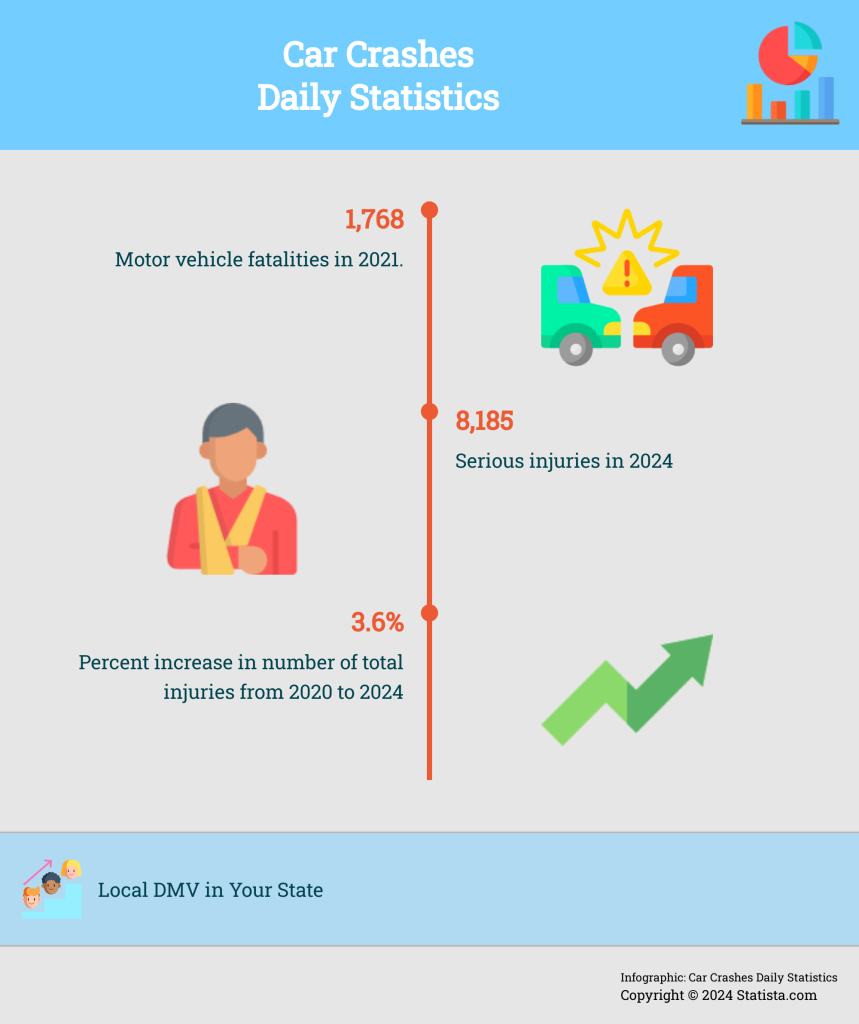
Here are samples we created