How to Convert a Table to an Infographic With AI
Tables are a great way to organize and present data. However, they can be bland and unengaging. Infographics, on the other hand, are visually appealing and shareable but it takes time.
By following these steps, you will be able to transform your data into a visually appealing and shareable format. Our AI tool makes it super easy.
Key Takeaways:
- Infographic.Ninja lets you input a table and the AI will make an infographic based on the information.
- Converting tables to infographics via A.I. can make your data more appealing and shareable
- There is an AI tool to convert tables to infographics automatically
- You can also manually convert tables to infographics by selecting the right visual elements and presenting your data effectively
- Infographics can effectively communicate complex information in a more digestible format
- Transforming your tables into infographics can take your visual content game to new heights
Utilizing AI Infographic Generators for Easy Conversion
Converting a table to an infographic can be a time-consuming process, but with the help of AI-powered infographic generators, you can streamline the process and create professional-looking infographics quickly and easily.
An AI infographics generator is a tool that uses artificial intelligence algorithms to automatically transform tabular data into visually appealing graphics. These tools are designed to save you time and effort, while still delivering high-quality results.
Creating Infographics with A.I.
Simply copy the table and paste it into Infographic Ninja! That’s it!
By using an AI infographics generator, you can create infographics with ease. Simply upload your table data, select a template, and let the software do the work for you. The tool will automatically select the best graphics and layout to present your data in an engaging and informative way.
One advantage of using an AI infographics generator is that you don’t need any design skills. The tool will handle the design for you, ensuring that your infographic looks polished and professional every time.
Transform Table into Infographic
Another benefit of using an AI infographics generator is that many of these tools offer a “table into infographic” feature. This means that you can simply upload your table data and the tool will automatically convert it into an infographic, saving you valuable time and effort.
Overall, utilizing an AI infographics generator for easy conversion is a great way to streamline the process of converting a table into an infographic. With these tools, you can create professional-looking infographics quickly and easily, without any design skills.
Manual Conversion: Step-by-Step Guide
If you prefer a hands-on approach to converting your table into an infographic, it’s essential to follow these steps to ensure your final product is both visually appealing and informative.
Step 1: Select the Right Visual Elements
The first step is to choose visual elements that will best represent your data. Consider using icons, images, and charts to effectively communicate your information. Additionally, you may want to use different shapes and colors to distinguish between different data points.
Step 2: Choose a Suitable Layout
Choosing a suitable layout is critical to ensure your infographic is easy to follow and understand. Consider the flow of your information and choose a layout that presents it in a logical, visually appealing manner. Some popular layouts include vertical, horizontal, and grid formats.
Step 3: Effectively Present Your Data
Once you’ve selected your visual elements and layout, it’s time to present your data. Use concise and straightforward language to explain your information and make it easy for your audience to understand. Consider adding captions or labels to further clarify your data.
By following these steps, you can transform your table data into a visually appealing and informative infographic that effectively communicates your message.
Conclusion
Converting a table into an infographic is an effective way to enhance the visual appeal of your data. By following the guidelines outlined in this article, you can convert your tabular data into a visually engaging and informative infographic. Whether you choose to use an AI-powered infographic generator or manually create your infographic, make sure to select the right visuals, layout, and colors that best represent your data.
With the right tools and techniques, you can create infographics that effectively present your data and engage your audience. By leveraging the power of visual content, you can take your data communication game to the next level and achieve your communication goals.
FAQ
Q: How do I convert a table to an infographic?
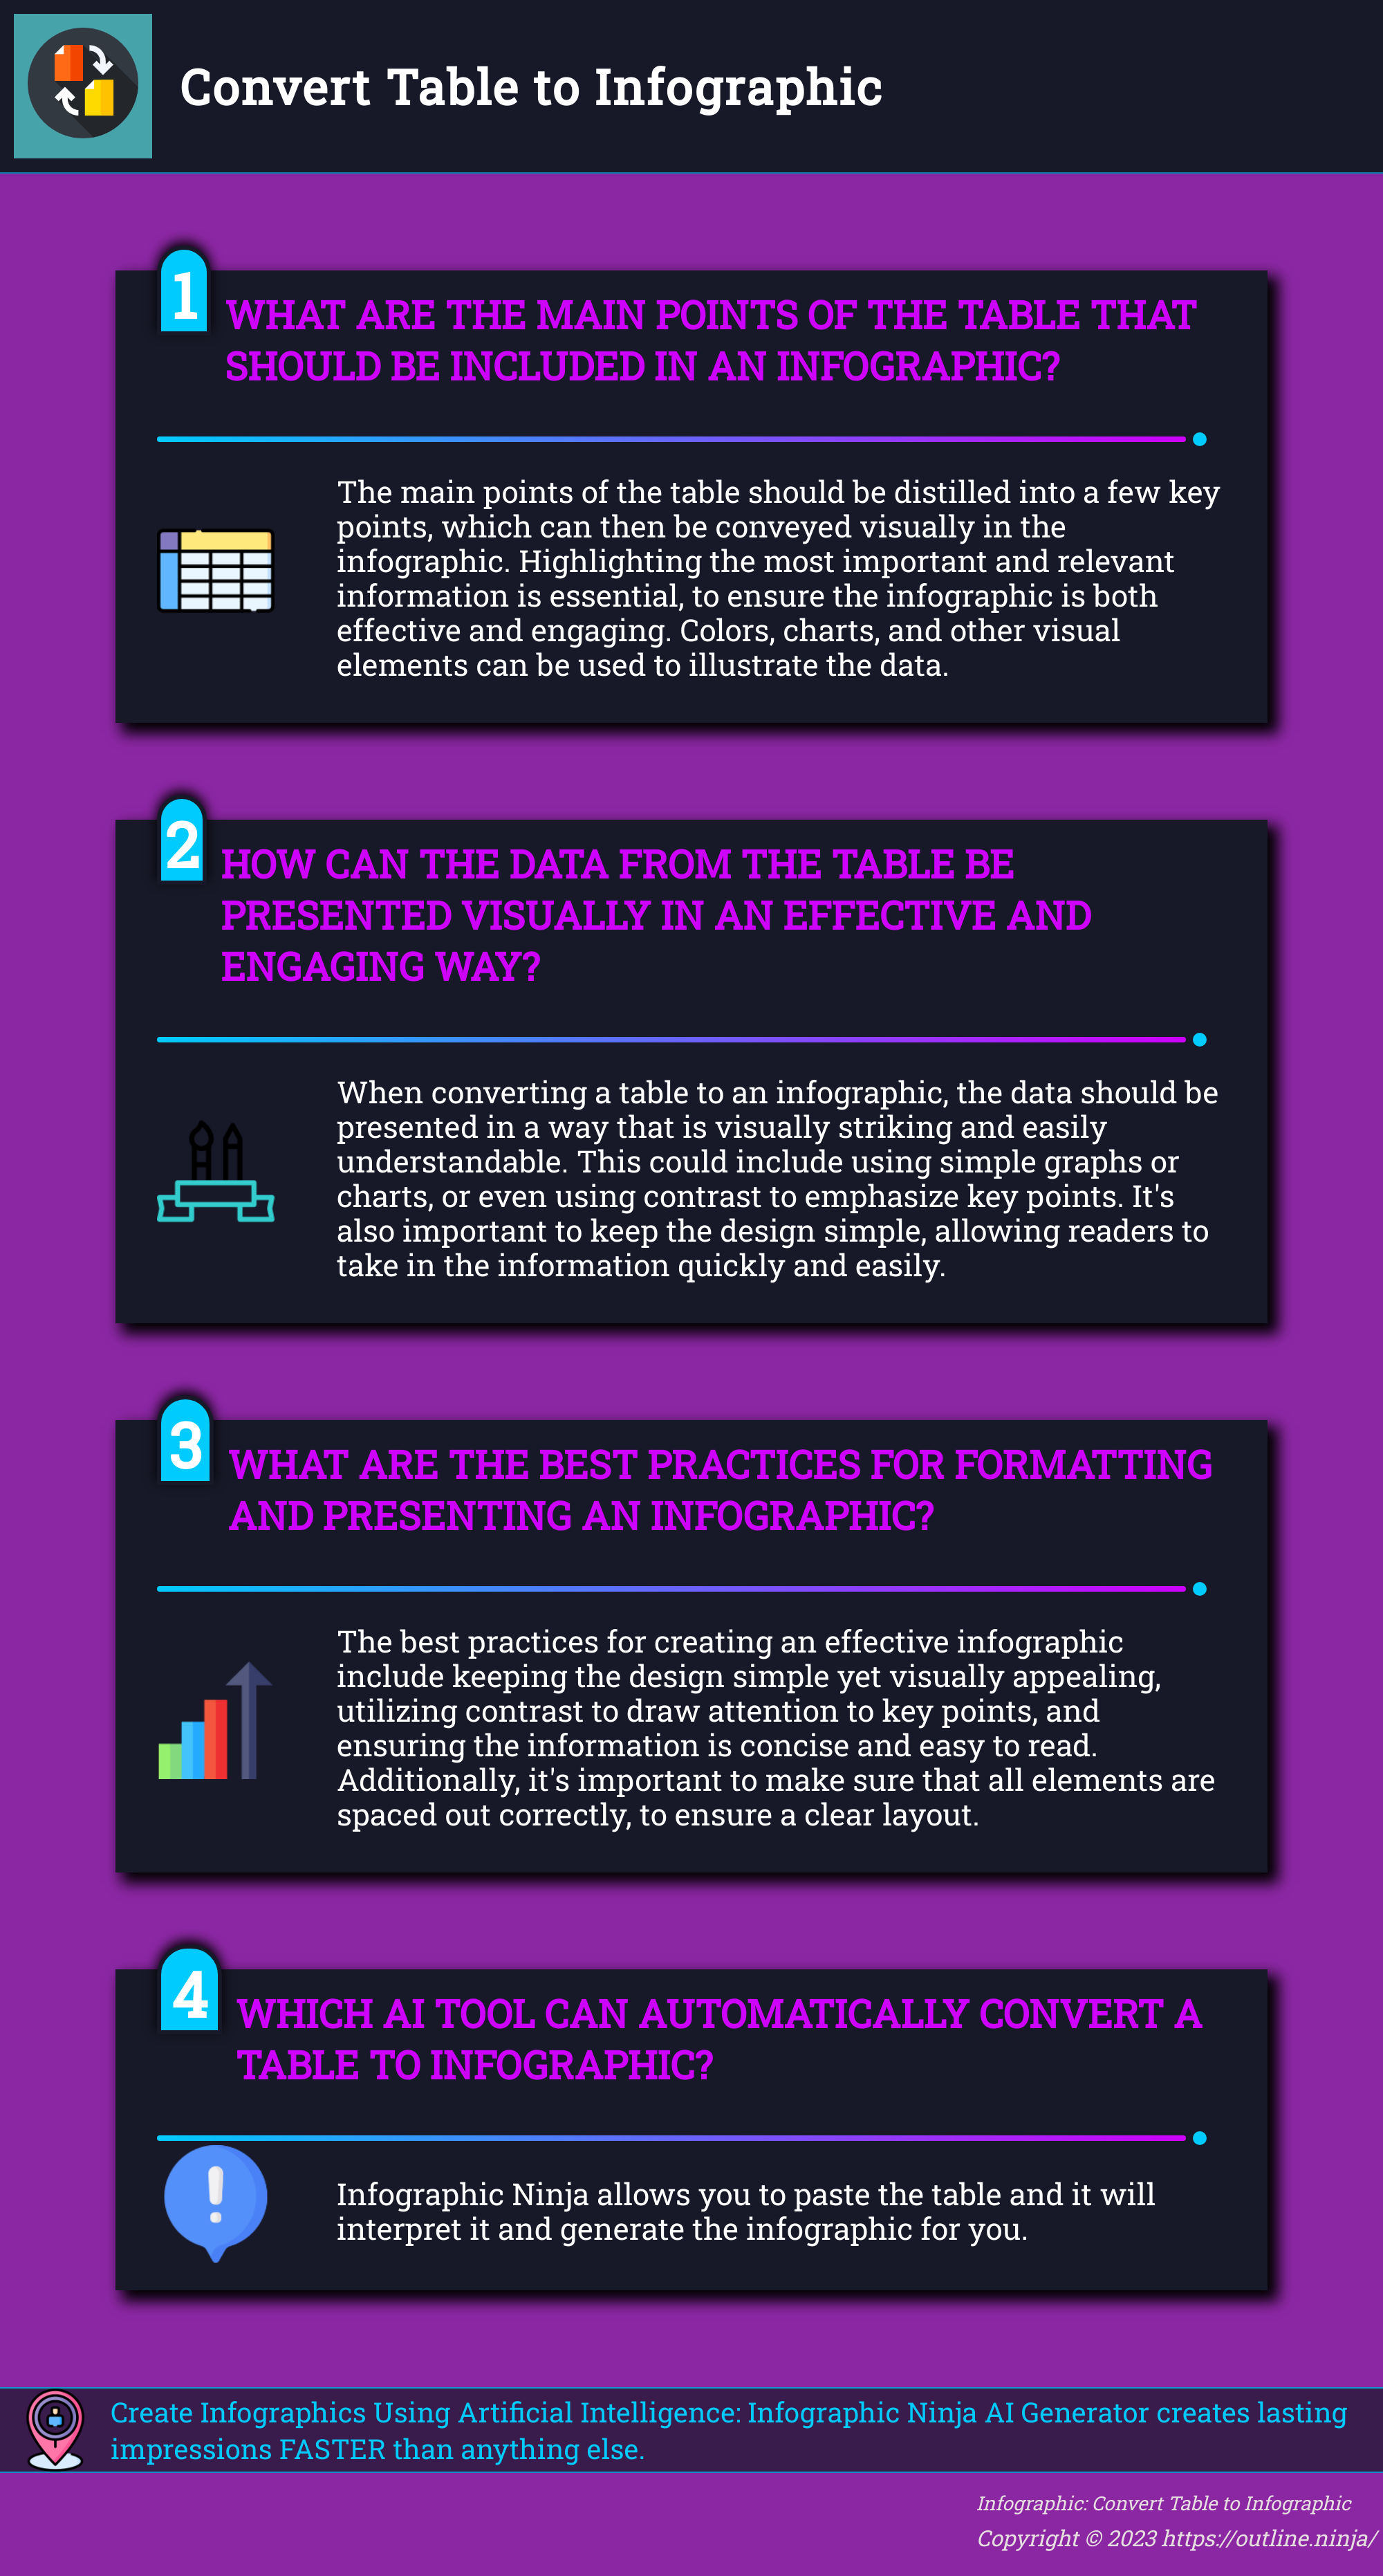
A: To convert a table to an infographic, you can either utilize AI-infographic generators or follow a manual conversion process. AI-infographic generators are tools that use artificial intelligence algorithms to transform tabular data into visually stunning graphics. If you prefer a more hands-on approach, you can manually convert your table by selecting the right visual elements, choosing a suitable layout, and effectively presenting your data.
Q: What are AI-infographic generators?
A: AI-infographic generators are tools that leverage artificial intelligence algorithms to automatically convert tabular data into visually appealing infographics. These tools save time and effort by eliminating the need for manual design and layout. By using an AI-infographic generator, you can create professional-looking infographics without prior design knowledge or skills.
Q: How can I manually convert a table into an infographic?
A: To manually convert a table into an infographic, follow these steps:
1. Select the visual elements: Choose appropriate icons, illustrations, and images that represent your data.
2. Choose a suitable layout: Determine how you want to organize and display your information. Consider using charts, graphs, or diagrams.
3. Design the infographic: Use a graphic design tool or software to create the visual representation of your table.
4. Present your data effectively: Ensure that your infographic is easy to understand and provides valuable insights to your audience.
Q: Why should I convert a table to an infographic?
A: Converting a table to an infographic has several benefits. It makes your data more engaging and visually appealing, which can attract and hold the attention of your audience. Infographics also make complex information easier to understand and remember. Additionally, infographics are highly shareable on social media platforms, allowing you to reach a wider audience and increase your content’s visibility.
#Table #infographic #AI #transformTable #generator