AI Data Visualization | Use InfographicNinja to Generate Infographics with AI
In today’s data-driven world, businesses are wrestling with massive amounts of data and are constantly seeking innovative ways to turn them into understandable insights. That’s where AI data visualization comes in, using algorithms and simple graphics to make sense of complex data sets.
Take your content marketing to another level with AI data viz!
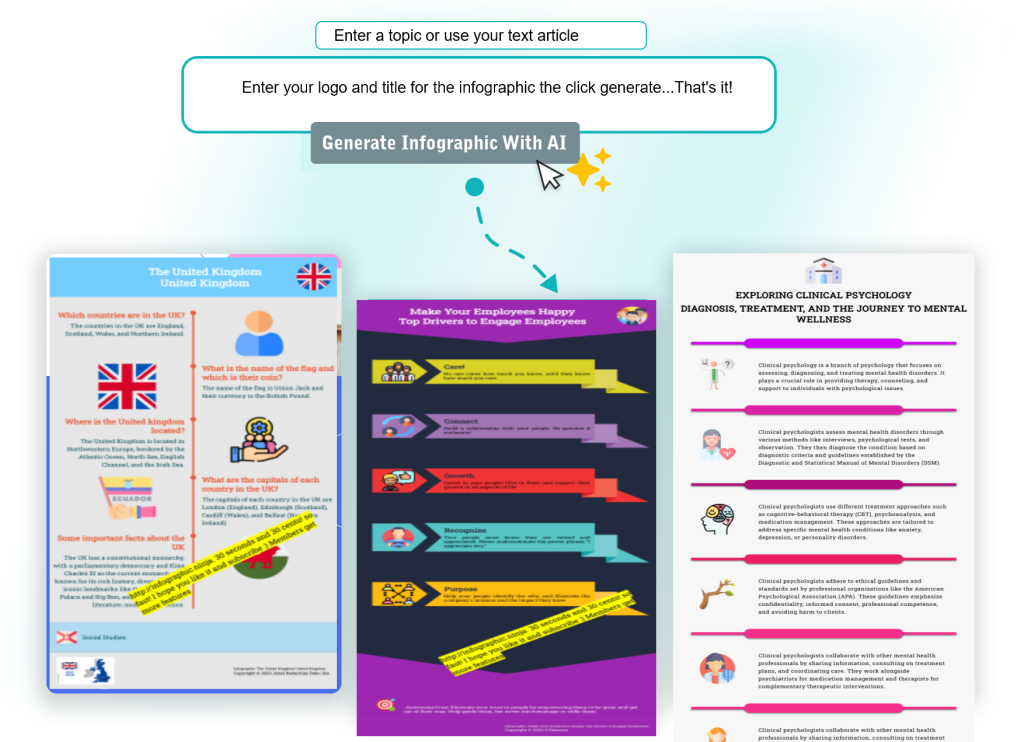
InfographicNinja, the top AI infographic builder, harnesses the power of AI to create stunning visuals out of raw text or data tables. With InfographicNinja, you can easily create explainer infographics that communicate your data’s story, all while saving valuable time and effort with the automation and power of AI.
Key Takeaways
- AI data visualization turns complex data sets into understandable insights.
- InfographicNinja is the first AI infographic generator platform.
- InfographicNinja lets you paste data or text for the AI to use.
Harnessing the Power of AI Data Viz Tools
When it comes to data visualization, infographics are a more fun way to show the data than charts and pies. It lets reader see icons, numbers, and explanatory text. This visual AI graphic can communicate complex insights with ease to lay people.
At Infographic.Ninja, we’re excited about the possibilities of AI visualization infographics. By streamlining the infographic creation process and create them in a matter of 30 seconds.
AI Data Viz: Making the Complex Simple
One of the biggest advantages of data viz tools is the ability to simplify complex data sets and automatically generate charts of different types. but, the information is still hard to convey to a lay person even when it is visualized.
With AI algorithms, we can quickly and accurately extract qualitative insights from the data and summarize it in a clear infographic.
AI infographics also allow us to experiment with simpler visualization techniques, identifying the most effective ways to present explanation for a broad audience. This flexibility ensures that our infographics are not only informative but also engaging and visually appealing for marketing and SEO professionals.
AI Data Viz Tools that Deliver Results
| Type | Features | Benefits |
|---|---|---|
| Machine Learning | Automatically identify patterns and trends in data | Speed up the analysis process and uncover hidden insights |
| Natural Language Processing | Analyze text data and extract key phrases and concepts | Create informative text-based infographics that communicate complex ideas |
| Image Recognition | Identify objects and patterns in images | Create visually dynamic graphics that incorporate images and icons |
At InfographicNinja, we’ve harnessed the power of AI to create information-based infographic images in PNG format. Whether you’re a data scientist, marketer, or just looking to communicate complex information in a visually engaging way, our AI data viz tools deliver the results you need.
Designing Infographics with AI: The Infographic.Ninja Advantage
Are you tired of spending countless hours designing professional infographics for your business? Look no further than InfographicNinja! Our top AI infographic tools provide a streamlined process for creating visually appealing graphics in no time.
Our AI-powered platform utilizes the latest technology to simplify the infographic design process. With InfographicNinja, you can say goodbye to clunky, outdated design software and hello to sleek, modern templates that are easily customizable to fit your brand.
Top AI Infographic Tools Offered by InfographicNinja
Our cutting-edge platform provides a range of AI infographic design tools to enhance your creativity and support your business goals. Here are some of our top tools:
| Tool | Description |
|---|---|
| Customizable Templates | Choose from a variety of pre-designed templates that are easy to customize with your own data and brand logo/color/font. |
| Smart Charts | Our AI-powered smart charts (coming soon) intuitively transform data sets into stunning visual representations, quickly and efficiently. |
| Image Search | Share your infographics on social media and get ranking on Google Image Search. |
With these tools, you can create professional infographics that effectively communicate your message and engage your target audience. Plus, our platform is user-friendly and easy to navigate, making it accessible to users of any background.
So why wait? Sign up for InfographicNinja today and start designing AI-infused graphics that will take your business to the next level!
Creating Data-Driven Infographics with Ease
So you want to create an epic infographic? But you don’t have design skills? Fear not! We’ve got you covered with our AI data graphics builder, a tool that will give you the power to create stunning visuals with just a few clicks.
Steps to Create Infographics with AI
- First things first: log in to InfographicNinja and select the AI infographic design tool.
- Upload your data and watch as our AI algorithms transform it into a visually appealing format.
- Select a template that fits your aesthetic and tweak the design to your liking.
- Add text, icons, and images to give your infographic that extra pop.
- Save and share your masterpiece with the world!
See how simple that was? Our AI-powered platform takes care of the heavy lifting, leaving you free to focus on creating an informative and entertaining infographic that your audience will love.
And if you get stuck or have any questions, our customer service team is always here to help.
The InfographicNinja App: AI Infographics at Your Fingertips
Are you tired of being tethered to your desktop when creating infographics? Well, you’re in luck because InfographicNinja has an app for that! Our AI-powered platform is now accessible directly from your smartphone or tablet, allowing you to create stunning infographics on-the-go.
With the InfographicNinja app, you don’t have to sacrifice convenience for quality. Our advanced AI technology ensures that you’ll still get top-notch infographic designs, even while working from your mobile device.
Infographic Creation Made Easy
Our app’s intuitive interface makes creating AI-driven infographics a breeze. It’s never been easier to transform complex data sets into visually engaging graphics. Plus, you don’t need any design experience to get started! Our AI tools take care of the heavy lifting, so you can focus on telling your story.
The Benefits of InfographicNinja’s App
The flexibility offered by our builder is unmatched and the speed is unheard of. You can create AI-infographics whenever and wherever inspiration strikes in just 30 seconds. Other tools take 30 minutes to customize your infographic after you spend time understanding the data table.
Introducing the InfographicNinja Platform
Now that you’re familiar with the benefits of AI data visualization and the power of AI data viz tools, let’s dive into what sets InfographicNinja apart as the top AI infographic platform out there.
At InfographicNinja, we’ve taken everything we know about AI and data visualization and created a unique platform that combines the best of both worlds. Our platform utilizes the latest in AI technology to provide users with a streamlined and efficient infographic creation process like no other.
Features and Functionalities
Our platform boasts a range of features and functionalities that make it stand out from the rest. Here are just a few:
- An intuitive form to fill in.
- Access to a library of over 20+ templates.
- Advanced AI algorithms that analyze data and automatically generate readable summaries.
These features, coupled with our user-friendly interface and commitment to customer satisfaction, make InfographicNinja the go-to platform for AI infographic design.
Our Commitment to Quality AI Visualization
At InfographicNinja, we understand the importance of quality in data visualization. That’s why we’re committed to providing our users with top-notch service and the highest quality infographics on the market. Our AI-powered platform ensures that every infographic is optimized for accuracy, visual appeal, and maximum impact. Simple to read infographics are produced for your data with a few clicks.
Why Choose InfographicNinja?
Choosing Infographic.Ninja means choosing a platform that values innovation, creativity, and excellence in AI infogrpahics. Our dedication to AI technology and data visualization sets us apart from the competition, and we’re constantly working to improve and expand our offerings to better serve our clients.
We believe that everyone should have access to high-quality data visualization tools, and we’re on a mission to make that a reality. Join us in unlocking the true potential of AI data visualization with InfographicNinja.
So what are you waiting for? Sign up for InfographicNinja today and experience the power of AI infographic design!
Unlocking the Potential of AI Data Visualization
Ah, AI data visualization. Is there anything it can’t do? From transforming boring, incomprehensible data into beautiful and clear graphics, to making us all look like tech-savvy geniuses, AI has truly revolutionized the way we approach data. And at InfographicNinja, we’ve harnessed the power of AI to create stunning infographics with just a few clicks.
With AI at our fingertips, we can now analyze and interpret vast amounts of data with ease, providing us with insights and solutions that we never thought possible. And with our AI infographic design tools, we can transform these insights into visually stunning graphics that will impress even the most hard-to-please stakeholders.
The Power of AI Data Visualization | Detailed advice
Let’s face it, data can be overwhelming. Rows and columns of numbers, graphs, and charts can quickly become a sea of confusion. But with AI data visualization, we can make sense of it all. By transforming complex data sets into clear and concise paragraphs, we can better understand, communicate, and act on the information at hand on social media and blogs.
At InfographicNinja, we’ve seen firsthand how AI data visualization can unlock untold potential for businesses, allowing them to make informed decisions, identify trends, and communicate their findings with ease. And with our top AI infographic design tools, we’ve made it easier than ever before to turn data into compelling visual stories.
Advice for AI data VIZ:
- Understand Your Data:
- Begin by thoroughly understanding the data you’re working with, its structure, and the insights you want to convey.
- Choose the Right Tool:
- Select a data visualization tool or library that is well-suited for your data and the story you want to tell. AI can help you choose the right chart types automatically.
- Preprocess Data:
- Clean and preprocess your data to ensure accuracy and consistency in your visualizations.
- Feature Engineering:
- Use AI to discover meaningful features or dimensions in your data that can enhance the clarity of your visualizations.
- Automate Insights:
- AI can help automate the process of identifying significant trends or patterns in your data, making it easier to create insightful visualizations.
- Interactivity:
- Incorporate interactive elements into your visualizations to allow users to explore the data and gain a deeper understanding.
- Color and Design:
- Use color and design principles to make your visualizations visually appealing and accessible. AI can assist in color scheme recommendations.
- Annotation:
- Label your visualizations with appropriate titles, axis labels, and annotations to provide context and clarity.
- Scalability:
- Ensure that your visualizations can scale with large datasets, and consider using AI for dynamic data aggregation and summarization.
- Real-Time Updates:
- Implement AI-driven solutions that can update your visualizations in real time as new data becomes available.
- User-Centered Approach:
- Consider the needs and preferences of your target audience when designing visualizations, and use AI to customize content for different user groups.
- Narrative Flow:
- Create a logical and engaging narrative flow within your visualizations to guide users through the data story.
- Accessibility:
- Ensure that your visualizations are accessible to users with disabilities by using AI to generate alt text for images and providing other accessibility features.
- Testing and Feedback:
- Test your visualizations with users and gather feedback to make iterative improvements.
- Security and Privacy:
- When dealing with sensitive data, use AI to implement robust security measures to protect data integrity and user privacy.
- AI-Driven Suggestions:
- Many AI-powered tools can provide suggestions for improving your visualizations, such as chart type recommendations and color palette suggestions.
- Collaborate and Share:
- Use AI-powered collaboration platforms to work with team members and share your data visualizations efficiently.
- Stay Informed:
- Keep up to date with the latest AI advancements in data visualization to leverage new techniques and tools.
- Ethical Considerations:
- Be mindful of ethical considerations when using AI for data visualization, such as bias and fairness in data representation.
- Documentation:
- Document your data visualization process, including the tools and AI algorithms used, for transparency and reproducibility.
The Advantages of AI-Driven Infographics in ai infographic design
So, what are the benefits of using AI-driven infographics for data visualization? Let’s break it down:
- Improved efficiency: With AI, we can quickly and easily transform data into graphics, saving time and resources.
- Accuracy: AI algorithms can analyze and interpret data with precision, ensuring that our graphics are accurate and reliable.
- Visual appeal: Let’s face it, graphics are just more fun to look at than rows of numbers. With AI, we can create visually engaging graphics that capture the attention of our audience.
And the best part? We can do it all with just a few clicks.
Transforming Your Data into Compelling Visual Stories
At InfographicNinja, we’re all about telling stories with data. With our AI infographic design tools, we can take raw data and turn it into an engaging narrative that captures the imagination of our audience.
Whether we’re highlighting a trend, showcasing the impact of a product, or simply presenting data in a clear and concise manner, our AI tools make it easy to create compelling visual stories that leave a lasting impression.
So, let’s unlock the potential of AI data visualization together. With InfographicNinja’s AI-powered platform, we can transform data into beautiful graphics and unlock insights that will drive our businesses forward. Why settle for boring data when we can have stunning graphics that tell a story?
Advantages of AI-Driven Infographics
Let’s face it, creating visually appealing infographics can be a daunting task, especially when dealing with complex data sets. Fortunately, AI-powered tools have made this process more efficient and accurate than ever before. Here are just a few advantages of using AI-driven infographics for data visualization:
- Efficiency: With AI-powered platforms like InfographicNinja, businesses can create high-quality infographics in a fraction of the time it would take to do so manually.
- Accuracy: AI algorithms can quickly analyze large amounts of data, ensuring that infographics are based on accurate and reliable information.
- Visual appeal: AI data visualization tools can transform complex data sets into engaging and visually appealing graphics that capture the attention of audiences.
But don’t just take our word for it. Let’s take a look at some real-life examples of businesses that have benefited from AI-driven infographics:
Transforming Your Data into Compelling Visual Stories
So, you’ve got your data all sorted and compiled. But now what? How can you turn it into a compelling story that people will actually want to read?
This is where AI infographic design and data visualization come into play. By harnessing the power of AI, you can transform your raw data into stunning visuals that tell a story and capture your audience’s attention.
With InfographicNinja’s AI-powered platform, creating beautiful and informative infographics has never been easier. Our top AI infographic tools take care of the design process for you, making it easy to create impressive graphics that showcase your data in a new light.
The Power of Storytelling in Data Visualization
Humans are naturally wired for storytelling. We remember stories much more easily than we do raw data. This is why infographics are so effective. They take complex information and turn it into a story that people can easily understand.
AI infographic design takes this storytelling one step further. By using artificial intelligence to analyze your data, it can identify patterns and insights that might not be immediately obvious to the human eye. It can then use these patterns to design graphics that tell a deeper story.
The Benefits of AI Data Visualization
There are many benefits to using AI data visualization and infographic design for your business. Here are just a few:
- Improved efficiency: AI can automate much of the design process, allowing you to create infographics much faster than if you were doing it manually.
- Greater accuracy: By analyzing your data, AI can identify patterns and trends that may be difficult for humans to spot. This can lead to more accurate and insightful graphics.
- Visual appeal: Let’s face it, people are more likely to engage with your data if it’s presented in a visually appealing way. AI data visualization allows you to create graphics that are both informative and beautiful.
- Speed!
Real-Life Examples of AI-Driven Infographics
Don’t just take our word for it. There are plenty of real-life examples of businesses that have seen great results from using AI data visualization and infographic design.
As you can see, the possibilities are endless when it comes to AI data visualization and infographic design. With an AI-powered platform like InfographicNinja, the sky’s the limit. So, what are you waiting for? Let’s transform your data into a compelling visual story today!
Conclusion
In your AI data visualization journey, we hope you’re all the possibilities offered by InfographicNinja’s AI-powered platform. By harnessing the power of AI data viz tools and AI infographic design, you can turn even the most complex data sets into visually stunning and compelling graphics.
FAQ on AI DATA VIZ
What is AI data visualization?
AI data visualization refers to the use of artificial intelligence technology to transform complex data sets into visually appealing and informative graphics. It utilizes algorithms and machine learning to create compelling visual representations of data with clear text and FAQs.
How can InfographicNinja help with AI data visualization?
InfographicNinja is an AI-powered platform that enables users to input data or tables for the AI to automatically create professional infographics for you. It harnesses the power of AI data visualization tools to streamline the process and generate visually stunning graphics.
What are the benefits of using AI-infographic design?
AI-infographic design offers several advantages, including improved efficiency, accuracy, and visual appeal. It allows for the creation of data-driven infographics that effectively communicate information and captivate audiences. It speeds up your content creation process.
How do I create data-driven infographics with InfographicNinja?
Creating data-driven infographics with InfographicNinja is simple. Just follow these steps: 1) Paste your data table or article, 2) Choose a template 3) Customize the infographic fonts and logo, 4) Download.
Is there an Infographic AI app available? | ai infographic app
Yes, InfographicNinja offers a convenient web app that allows users to create AI-powered infographics directly from any device thus speeding up their data vis content creation for marketing and SEO.
How can AI data visualization unlock the potential of data?
AI data visualization has the ability to transform the way businesses understand and communicate data. By utilizing AI algorithms and machine learning, it enhances the accessibility and impact of data, making it easier to extract valuable insights and tell compelling visual stories. There are other ways to do this so you can see our dalle-3 infographic generator with text article.
What are some Benefits of AI data visualization
Many businesses across various industries have leveraged AI data visualization to improve decision-making, communicate complex information, and engage their audiences. From healthcare organizations analyzing patient data to marketing agencies presenting campaign analytics, the possibilities are endless. Even educators are using infographic ninja!
How does AI enhance the creation of compelling visual stories?
AI enhances the creation of compelling visual stories by analyzing and interpreting data patterns, enabling the identification of key insights and trends. This allows for the development of narratives within infographics that effectively communicate complex information in a visually engaging manner.
What is the importance of AI data visualization in today’s data-driven world?
In today’s data-driven world, AI data visualization plays a crucial role in making sense of vast amounts of complex information. It allows businesses to effectively communicate insights and trends, empowering decision-makers to extract valuable knowledge and make informed choices.
#aiinfographicbuilder #automatedsmartinfographiccreator #infographics #AI #data #visualization

#Infographic #AI #generator #automated #generative #ArtificialIntelligence #dataviz #datavis #data #visualization